Open & inspect
Import data and review the experimental setup. Check instrument settings and injection details. Verify temperature and adjust concentrations.
 FT-ITC Analysis
From thermogram to thermodynamics
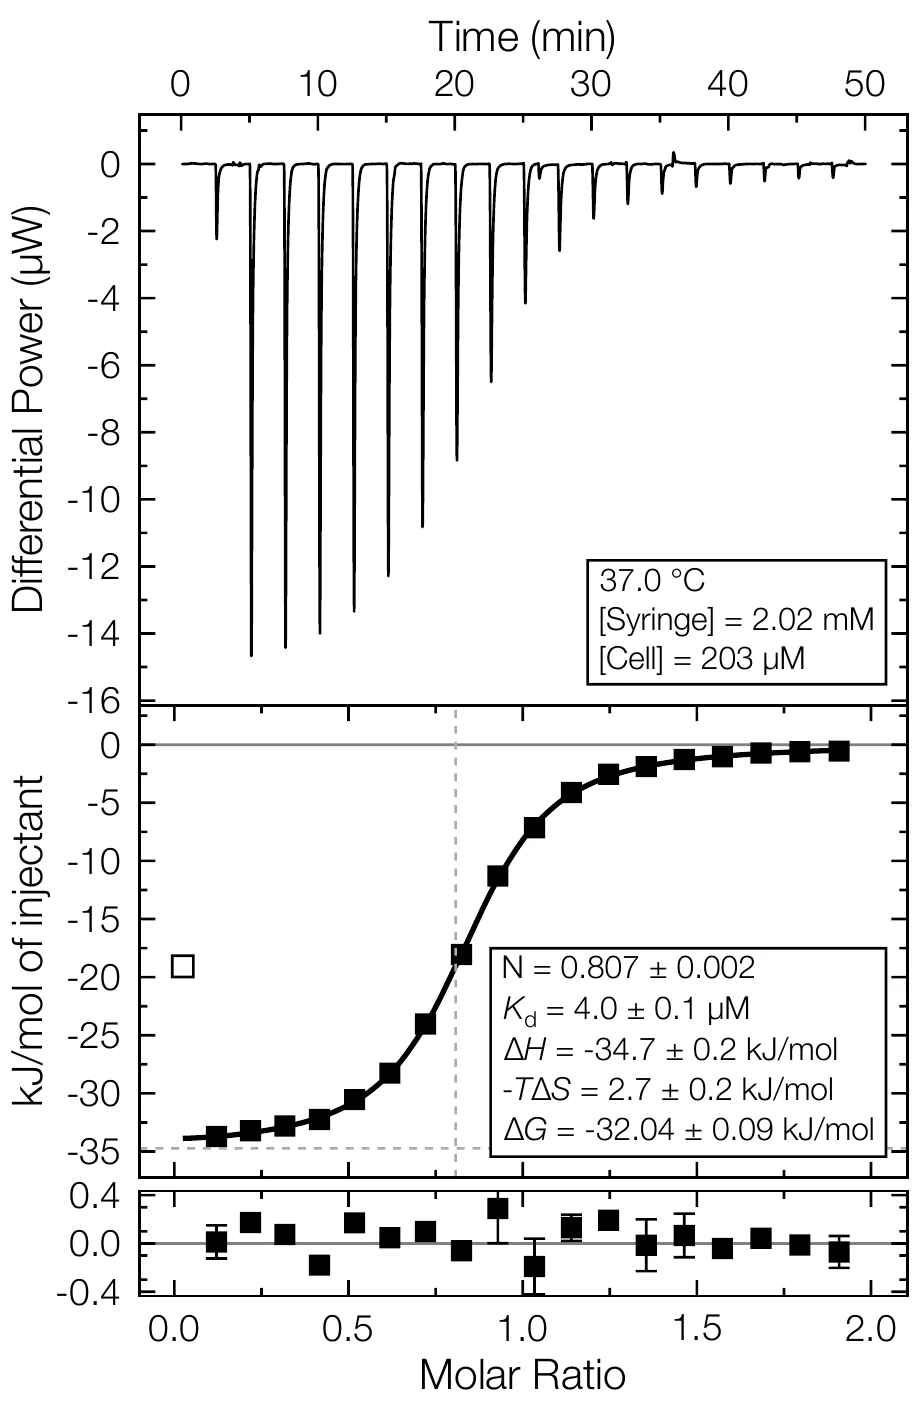
FT-ITC Analysis is a free, open-source desktop application for processing, fitting and presenting isothermal titration calorimetry data. It combines flexible raw-data processing with single- and multiple-experiment fitting, optional global constraints, uncertainty estimation and advanced thermodynamic interpretation.
Desktop first
Work with experimental data on your own computer, revisit any processing step and save complete analyses as portable FT-ITC projects.
From raw data to combined results
Research use cases
FT-ITC Analysis has been used to quantify binding thermodynamics and examine how molecular conformation changes an interaction.
A visible workflow
FT-ITC Analysis brings data import, processing, fitting, advanced analysis and figure creation into one application. Start with raw thermograms, integrated heats or an existing FT-ITC project. Adjust the workflow to the experiment and adapt to the needs of your data.
Import data and review the experimental setup. Check instrument settings and injection details. Verify temperature and adjust concentrations.
Refine polynomial, segmented or spline baselines; estimate or adjust integration regions; and apply buffer subtraction or merge tandem experiments when needed.
Fit one experiment or analyse related datasets together, use compatible advanced analyses and create publication figures, supporting panels and complete analysis reports.
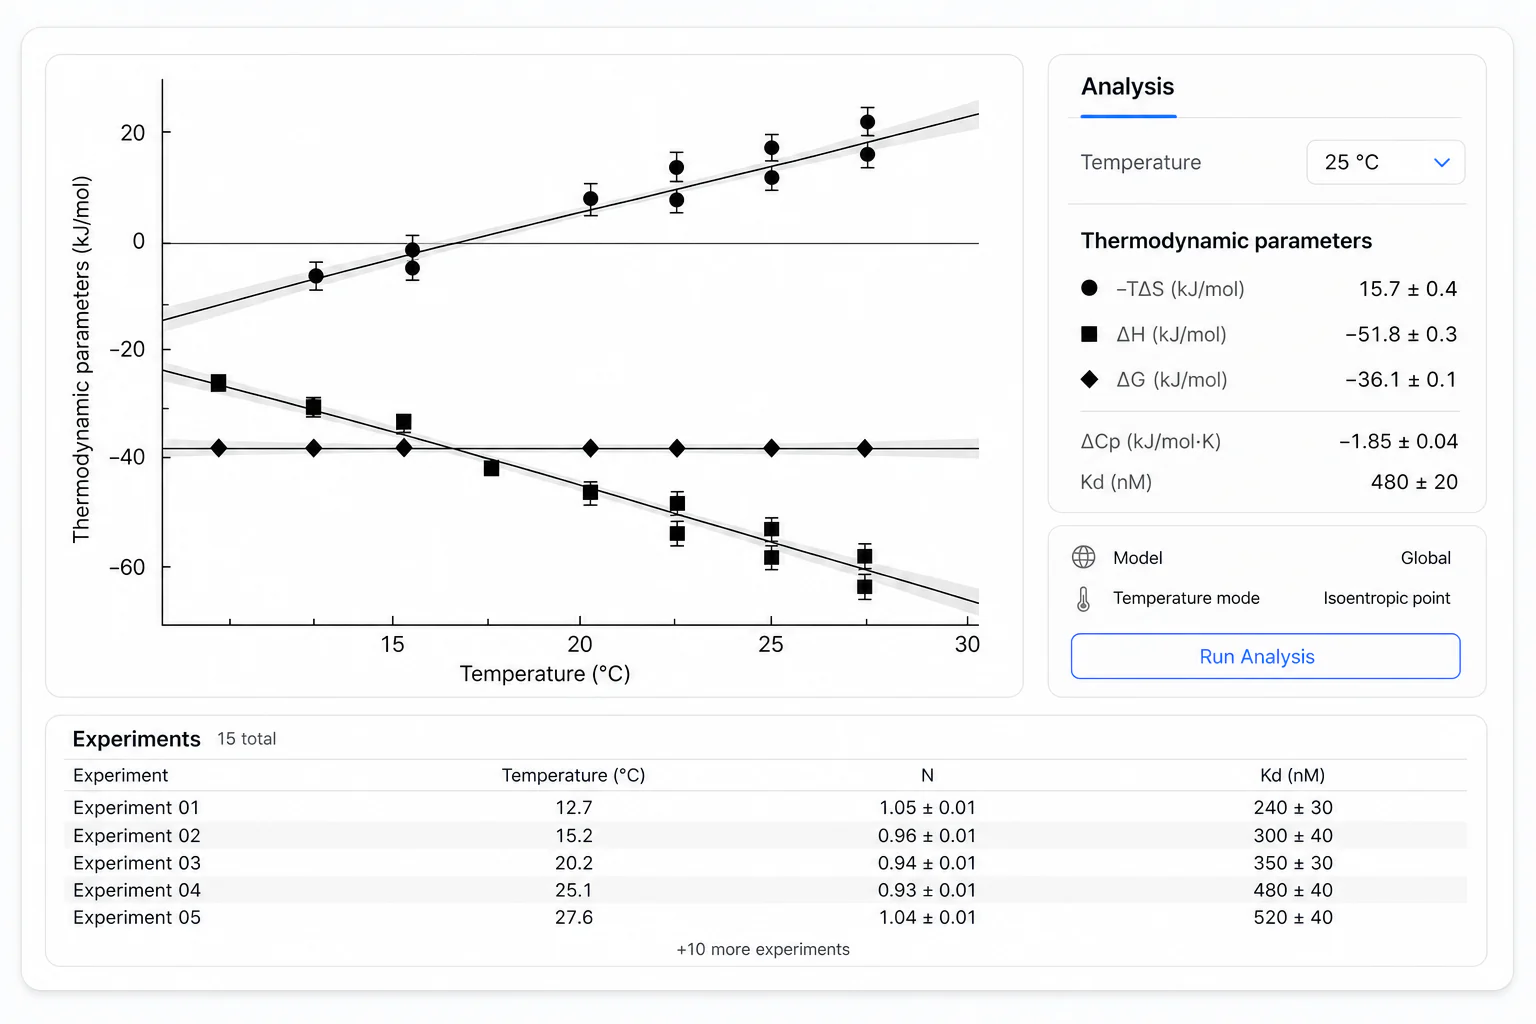
Multiple-experiment analysis
Fit several isotherms in one combined analysis. Keep parameters experiment-specific, share selected values across the series, or apply supported temperature-dependent relationships for a global fit.
See the app capabilities →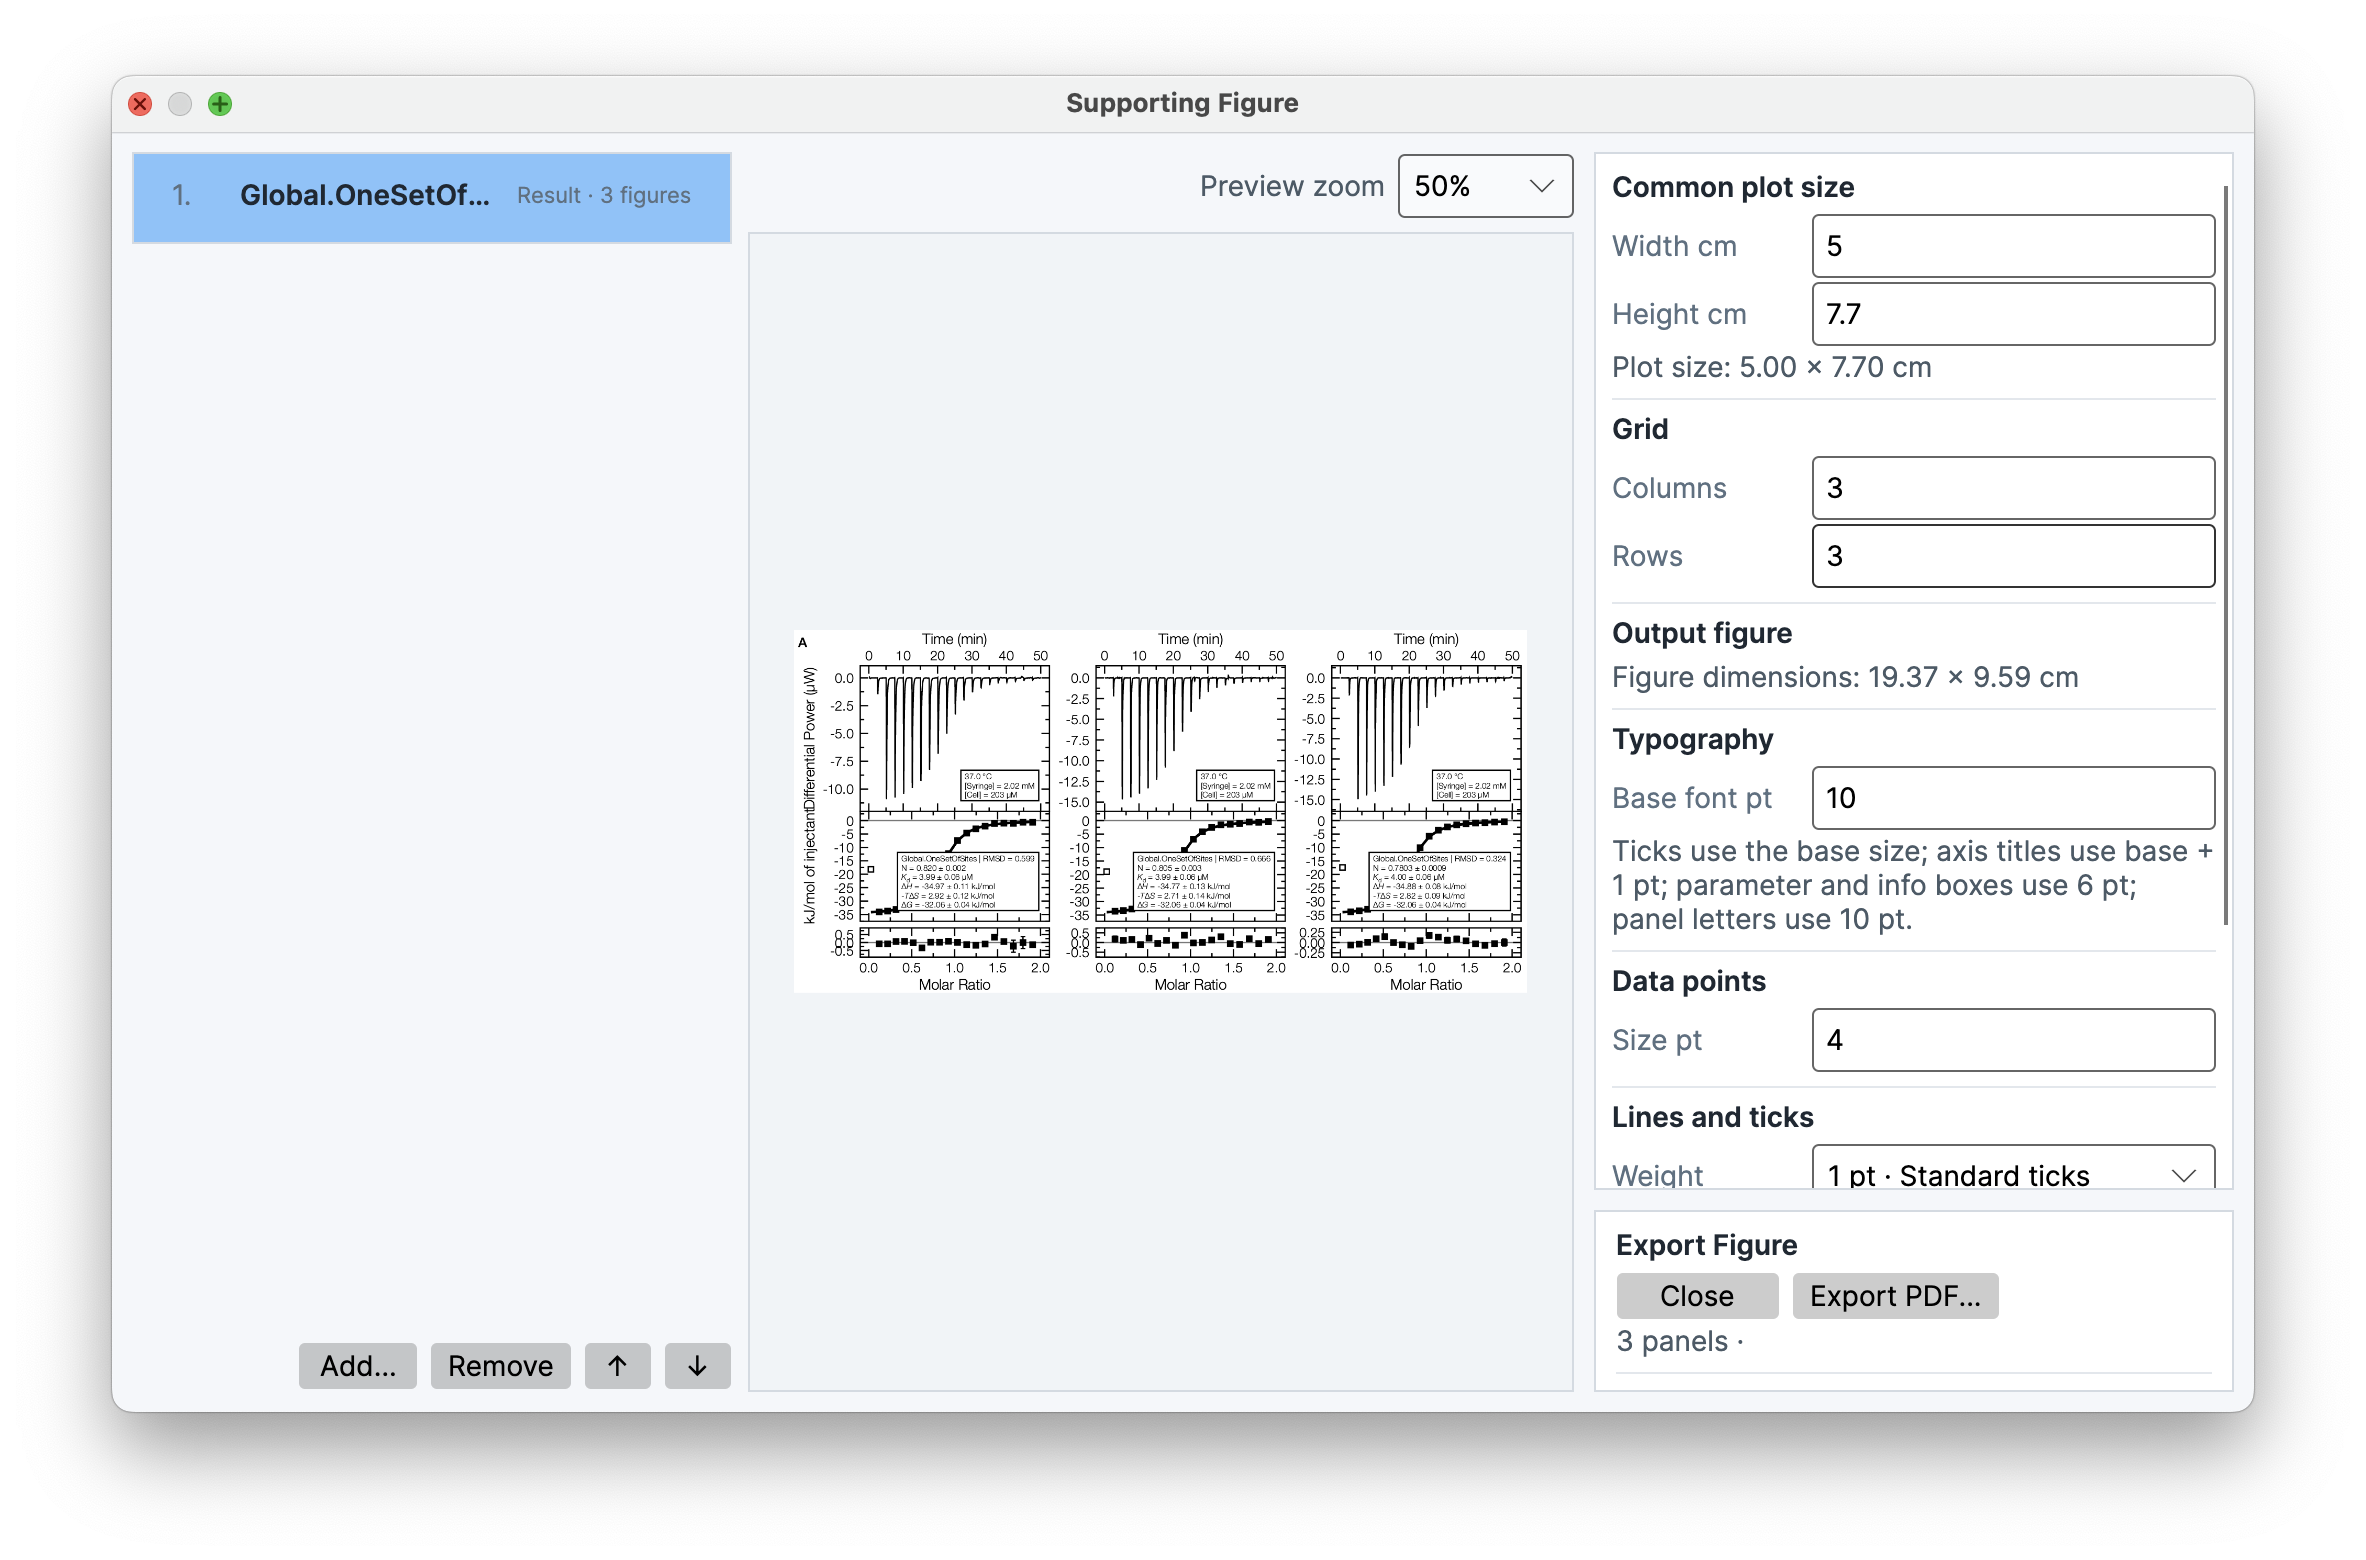
Figures and reports
Create publication figures, compose multi-panel supporting figures, and assemble complete PDF reports with saved results, tables, diagnostics and your interpretation.
Explore figures and reports →Web viewer
The online viewer opens FT-ITC project files for easy sharing and review, keeping experimental data, fits and analysis results together.
Checking availability… Open a project in the browser for easy sharing and review.
Open the web viewer ↗